Research MPC | FRET | FCS | MFD | SSFS
Research Areas Seidel Group | Fluorescence Correlation Spectroscopy (FCS)

In FCS, fluctuations of the fluorescence intensity, dF(t), with time, t, about an equilibrium value, <F>, (dF(t)=F(t)-<F>) are statistically investigated by calculating the normalized autocorrelation function, G(tc):

(tc - correlation time)
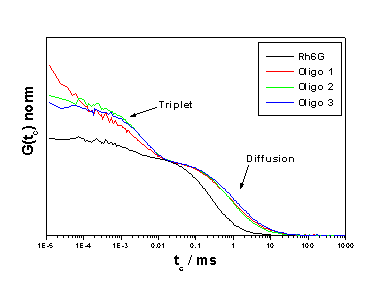
Every process leading to statistical fluctuations in the fluorescence signal (e.g., quenching kinetics, triplet formation, diffusion) will induce a characteristic decay time in the autocorrelation curve, G(tc). If translational diffusion and triplet formation are the only noticeable processes causing fluorescence intensity fluctuations, the normalized correlation function, G(tc), is given by

(N - mean number of molecules in detection volume; spatial distribution of detection volume v(x,y,z)=exp(-2(x2+y2)/v02)exp(-2z2/z02);
tD - characteristic diffusion time: tD=v02)/4D;
T - average equilibrium fraction of molecules in triplet state;
tT-triplet correlation time (function of rate constants for intersystem crossing, kISC, and triplet decay, kT).

